Plotting 2-D data (from http://linuxgazette.net/114/andreasen.html)
Example 1: Plotting x,y data
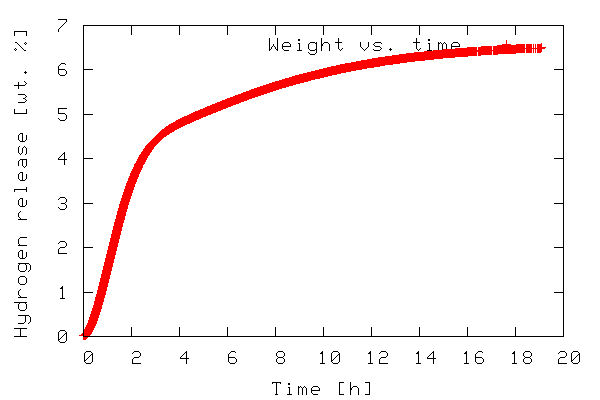
The first example illustrates plotting a 2-D dataset. The data to be plotted is included in the file tgdata.dat and represents weight loss (in wt. %) as a function of time. The plotting routine is in the file tgdata.py and the python code is listed below. Line numbers have been added for readability.
     1  from scipy import *
   2
   3  data=io.array_import.read_array('tgdata.dat')
   4  plotfile='tgdata.png'
   5
   6  gplt.plot(data[:,0],data[:,1],'title "Weight vs. time" with points')
   7  gplt.xtitle('Time [h]')
   8  gplt.ytitle('Hydrogen release [wt. %]')
   9  gplt.grid("off")
  10  gplt.output(plotfile,'png medium transparent picsize 600 400')
To run the code, download the tgdata.py.txt file, rename it to tgdata.py, and run it with python tgdata.py. Besides Python, you also need SciPy and gnuplot installed. Gnuplot version 4.0 was used throughout this article. The output of the program is a plot to screen as shown below. The plot is also saved to disk as tgdata.png per line 4 above.
In line 1, everything from the SciPy module is imported. In order to make use of the various functions of a module, the module needs to be imported by adding an import module-name line to the the python script. In this case it might have been sufficient to import only the gplt package and the io.array_import package. In line 3 the io.array_import package is used to import the data file tgdata.dat into the variable called data as an array with the independent variable stored in column 0 (note that array indices start with 0 as in C unlike Fortran/Octave/Matlab where it starts at 1) and the dependent variable in column 1. In line 4 a variable containing the file name (a string) to which the plot should be stored. In line 6-10 the gplt package is used as an interface to drive gnuplot. Line 6 tells gnuplot to use column 0 as x-values and column 1 as y-values. The notation data[:,0] means: use/print all rows in column 0. On the other hand data[0,:] refers to all columns in the first row.
The gnuplot png option picsize can be a little tricky. The example shown above works when Gnuplot is built with libpng + zlib. If you have Gnuplot built with libgd the required syntax becomes size and the specified width and height should be comma separated.
###################################
The single import statement (from http://www.scipy.org/PyLab)
What most users want is for a single import statement to get a consistent set of packages which fulfil most of their needs. This should consist of:
from pylab import *
That gets them NumPy, SciPy, and Matplotlib. A rough equivalent would be:
   1 from pylab import *
   2 from numpy import *
   3 from scipy import *

No comments:
Post a Comment